 Tassos Docs
- Getting Started
- Triggers
-
Display Conditions
- E-Commerce Conditions (VirtueMart - HikaShop)
- Homepage
- New/Returning Visitor
- K2 - Page Type
- K2 - Tag
- K2 - Category
- K2 - Item
- PHP
- Region
- City
- User Access Level
- Joomla! Content Component View
- Month
- Day of Week
- Cookie
- IP Address
- Referrer URL
- AcyMailing List
- Convert Forms Conditions
- Language
- Component
- Joomla! Content Category
- Joomla! Content Article
- Continent
- Country
- Operating System
- Browser
- Device
- Time on Site
- EngageBox - Viewed Another Popup
- Pageviews
- User
- User Group
- Time
- Date
- URL
- Menu
- Display Conditions
- Trigger based on URL match
- Campaign Types
- Styling and Customization
- Integrations
- Advanced Features
-
Functionality
- Αdd Sound Effects to Your Popups
- Make Accessible Popups
- Add a Countdown timer in your popup
- Limit impressions per unique visitor
- Test the responsiveness of your boxes for various devices and viewports
- Open a box by clicking on a menu item
- Trigger based on the minimum time visitor spent on the site
- Auto-Close popup after a specific time
- Open a box using HTML Attributes
- Solutions
- Developers
Google Analytics Integration
Integrating Engage Box Events data into your existing Google Analytics reports is easy and lets you view Engage Box Events, such as the Open and Close event, as custom events in your Google Analytics dashboard.
Enable Google Analytics Tracking
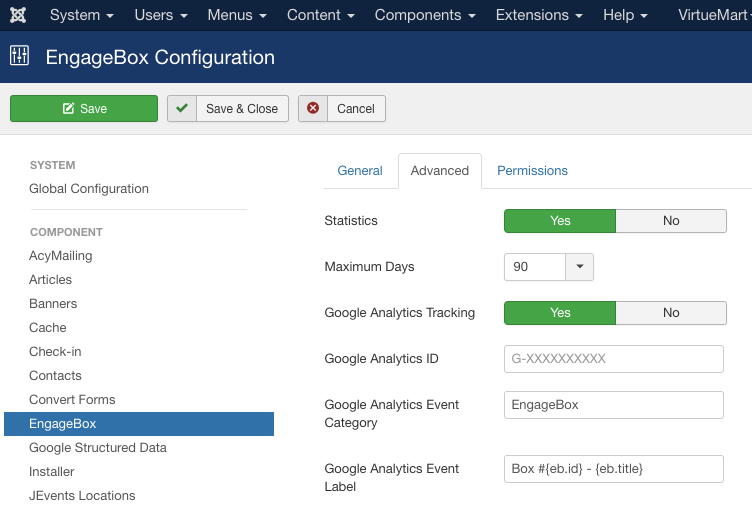
- Go to extension's configuration page
- Enable the Google Analytics Tracking option under the Tracking tab
- Enter your Google Property ID (G-XXXXXXXXXX)
- Optionally enter the event category label
- Save
Google Analytics Dashboard
As soon as the Google Analytics Integration is set, you are able to view each Engage Box event statistics through your Google Analytics dashboard.
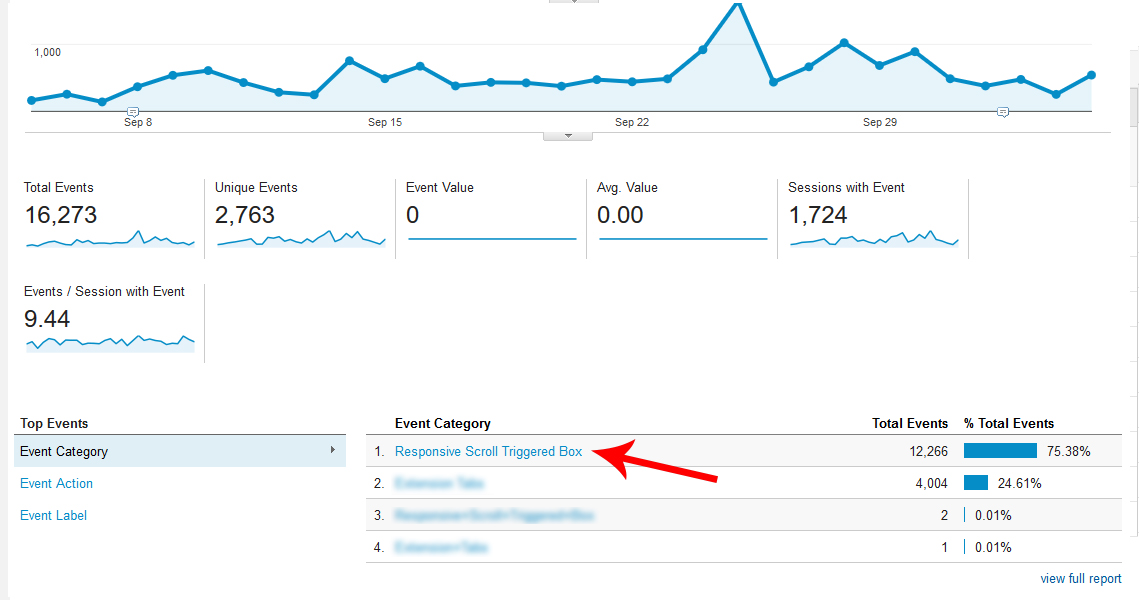
Login to your Google Analytics account . From the left menu navigate to Behavior -> Events -> Overview. You will notice a new Event Category with the name (Most likely Responsive Scroll Triggered Box) you've set in Engage Box preferences.
View All Tracked Boxes
Click on the "Engage Box" Event Category to filter all events based on that category.
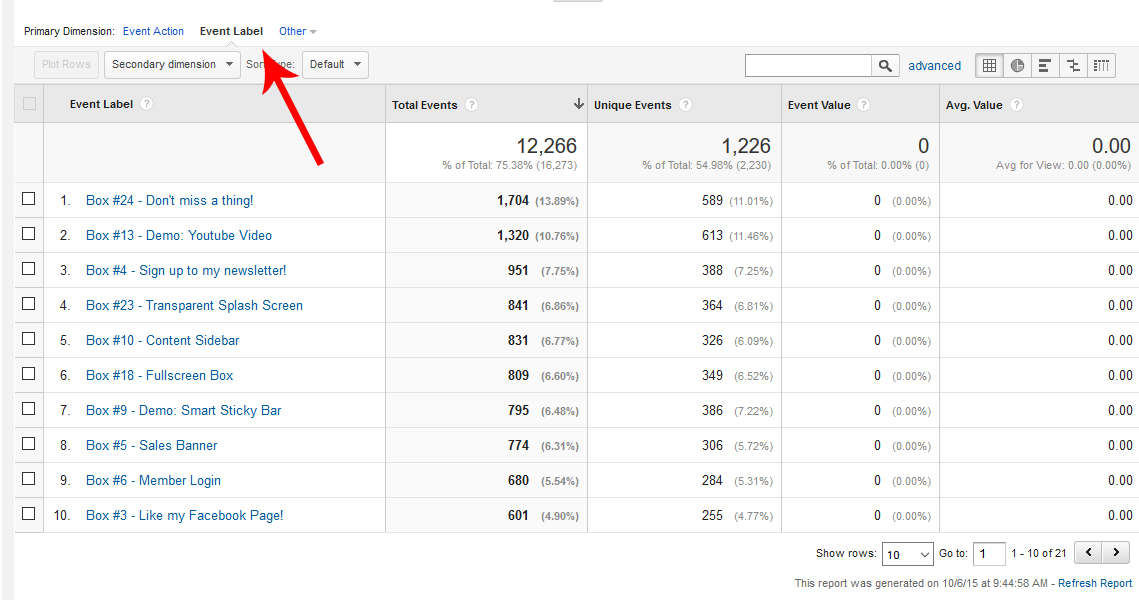
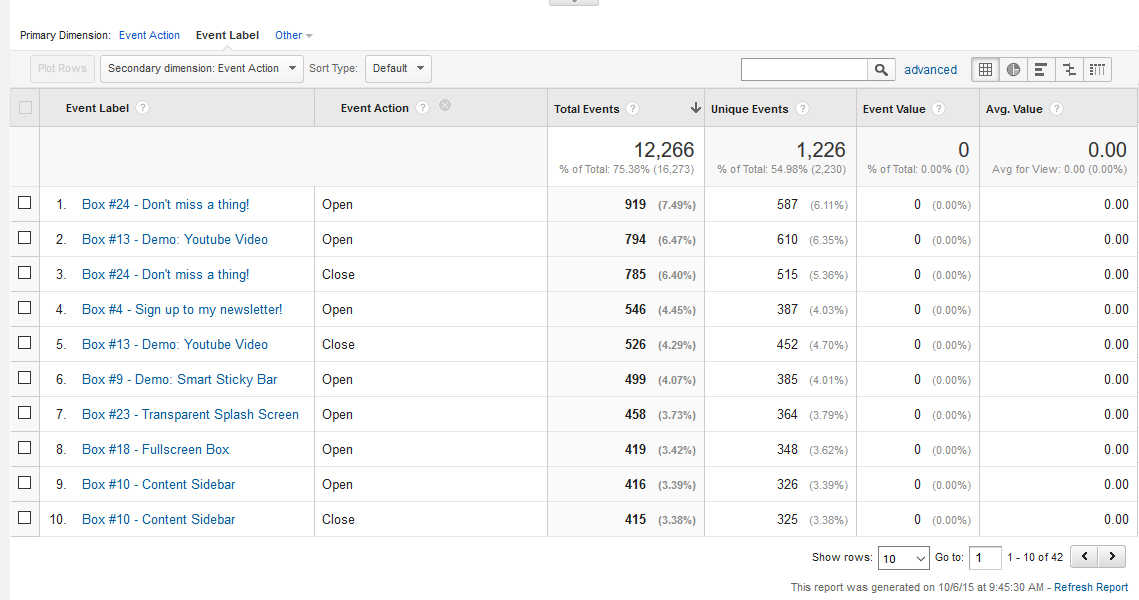
Then choose "Event Label" as the table's Primary Dimension. You will now notice a list of all your tracked boxes. The ID and Title of the box are used for the Event Label in order for you to be able to identify each box.
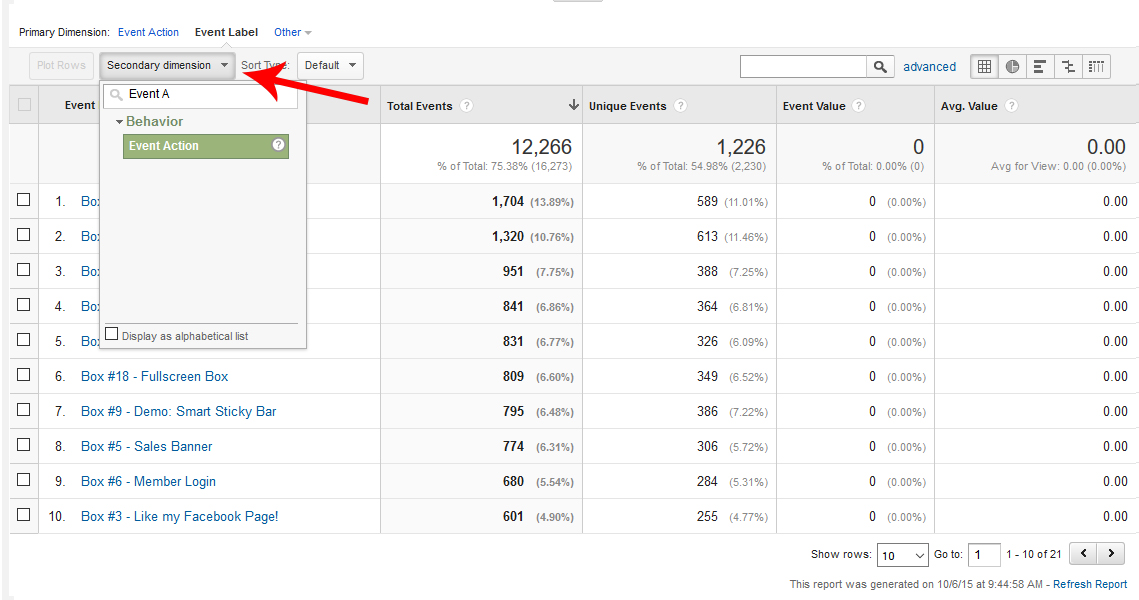
Now, we are going to add an extra table column regarding the Event's Action such as the Open and the Close event. Click on the Secondary Dimension listbox and search for the "Event Action".
Now, you have a complete picture of all of your tracked boxes.
Real-Time Stats
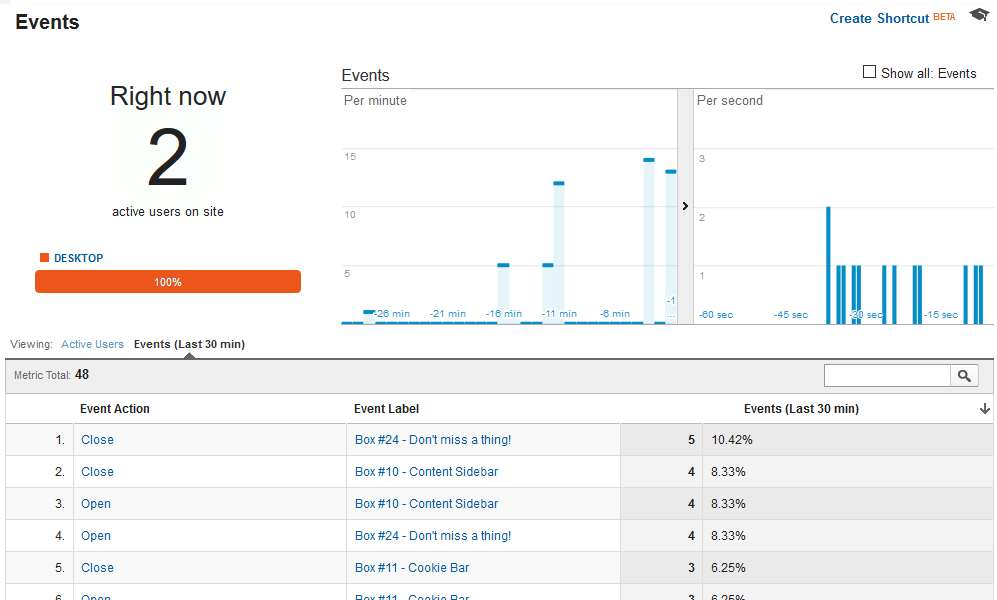
Real-Time allows you to monitor activity as it happens on your site or app. The reports are updated continuously and each hit is reported seconds after it occurs. For example, you can see how many people are on your site right now, which pages or events they're interacting with, and which goal conversions have occurred.
To see Real-Time Events: Select the "Reporting Tab" and then go to Real Time -> Events.
Smart Load of Google Analytics Library
Nowadays website speed is everything and we know it. We don't want to slow your website down. Thus, in order to avoid duplicate Google Analytics tracking code and increase your page's load time, Engage Box will try to find and use any existing loaded instance Google Analytics library in your page.
If Engage Box can't find any already loaded instance of Google Analytics, the Universal Google Analytics library will be loaded and used instead.
Want to get even more from Google Analytics?
To get the most out of Engage Box in Google Analytics, we highly recommend that you configure Goals, Funnels, and the Ecommerce options for Google Analytics. Configuring these parts of Google Analytics will not just help you get more from your Engage Box Statistics, but give you a much better understanding of your website as a whole.



 Rated: